Rules for A Sell Trade
Step #1: Wait for the MACD lines to develop a higher high followed by a lower high swing point.
First, let’s visualize how an authentic swing point really looks on the MACD indicator:
 |
| Not a proper swing high |
The first rule of thumb to recognize a swing high on the MACD indicator is to look at the price
chart if the respective currency pair is doing a swing high the same as the MACD indicator does.
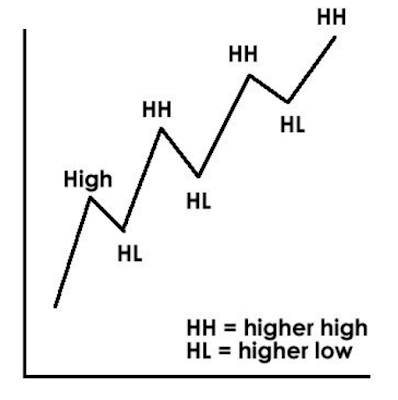
A higher high is the highest swing price point on a chart and must be higher than all previous
swing high points. While a lower high happens when the swing point is lower than the previous
swing high point.
 |
| Higher High and Lower Low |
This brings us to the next rule of the MACD Trend Following Strategy.
Step #2: Connect the MACD line swing points that you have identified in Step #1 with a trendline
This step is quite simple, right?
See below, how you chart should look like after you correctly identified the swing points on the
MACD indicator and connected them through a trendline.
 | ||
| MACD Trendline |
At this point, we really ignored the histogram because much of the information contained by the
histogram is already showing up by the moving averages.
Look at the price action now and compare it to our MACD trendline we drew early. We can clearly notice that the MACD contains the price action much better and reflects the trend much clear.
But, at this point, we’re still not done with the MACD indicator, which brings us to the critical part
of our MACD Trend Following Strategy.
No comments:
Post a Comment